Toolbox: Visualize raster band in Python
October 3, 2020
Toolbox notes are short and precise. There is no introduction. Just code and few comments about it. Article is designed to make it easy to reproduce the code and understand how it works.
Script to read and show all rasters in the given directory
- Imported libraries: os, NumPy, Rasterio, matplotlib.
- Two functions:
read_images()andshow_band(). read_images()takes two arguments:folder_nameandfile_end. Parameterfolder_nameis a string with a path to the directory which contains tiff rasters. Parameterfile_endis used to differentiate useful data from the other files. This function is not covered in the note.show_band()takes four parameters. One is necessary and three are optional. Starting from the first…bandis a numpy array read by the rasterio from the tiff file. It is processed inside the script to change allnan_valto numpy nan’s which are invisible in the matplotlib figure. (nan_valis the second parameter and its default value is zero). We shouldn’t perform this operation on the “living thing” to avoid problems with the data integrity and analysis output, so it is limited to the function scope.- Parameter
color_mapis taken from the Matplotlib’s colormaps (https://matplotlib.org/3.1.0/tutorials/colors/colormaps.html). Default value is Set1 due to the fact that image in this example is a classification output and has only few numbers. - The last parameter is
title. It is a string which describes image content. If none is passed then image title doesn’t appear. - The main function works as follow: variable
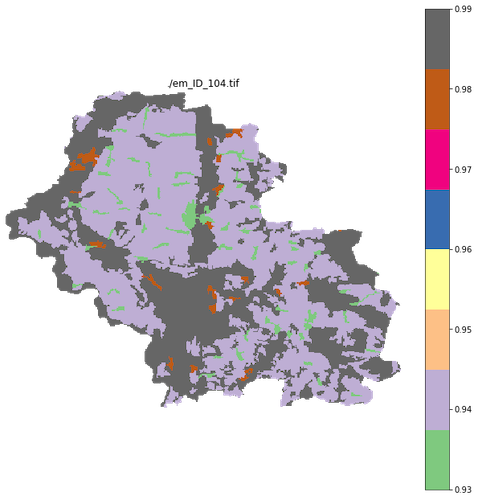
imagesis a list with the paths to each ‘.tif’ file stored in the folder where script is invoked. Then each element from the list is read by rasterio. Pixels are passed into theshow_band()function. Title is set to be a full path to the presented image. Parametercolor_mapis changed to ‘Accent’ because it gives better visual results than the default ‘Set1’ colormap.
import os
import numpy as np
import rasterio as rio
import matplotlib.pyplot as plt


def read_images(folder_name, file_end):
    file_list = os.listdir(folder_name)
    channel_list = []
    for f in file_list:
        if f.endswith(file_end):
            channel_list.append(folder_name + f)
    channel_list.sort()
    return channel_list

def show_band(band, nan_val=0, color_map='Set1', title=None):
    band = band.astype(np.float)
    band[band == nan_val] = np.nan
    plt.figure(figsize=(11, 11))
    image_layer = plt.imshow(band)
    image_layer.set_cmap(color_map)
    plt.colorbar()
    if title is not None:
        plt.title(title)
    plt.axis('off')
    plt.show()


if __name__ == '__main__':
    folder_address = './'
    file_ending = '.tif'
    images = read_images(folder_address, file_ending)
    for img in images:
        with rio.open(img) as src:
            image = src.read(1)
            show_band(image, nan_val=0, color_map='Accent', title=img)
Output:
Github: https://github.com/szymon-datalions/geoprocessing/blob/master/rasters/check_rasters.py


Subscribe
Login
0 Comments
Oldest