Data Science: Text Matching with Python and fuzzywuzzy
Do you have database with records indicating the same object but described in multiple ways by users? Think of the Main Square Street record which could be written as:
- The Main Sq Street,
- Main square,
- M. Square street,
- or much, much more…
The good news is that you’re not alone with the problem of multiple ways to describe one record! This pattern is extremely common. It is unavoidable when users have opportunity to name features as they like. The bad news is that string matching is not a trivial task and it’s rather a semi-supervised problem. Machine Learning algorithms help to find matches but output must be checked by the human operator and those algorithms are not able to find each match. In this tutorial we’ll take a look into the most popular algorithm for string matching: Levenshtein Distance.
Algorithm
In information theory, linguistics, and computer science, the Levenshtein distance is a string metric for measuring the difference between two sequences.
Wikipedia
Algorithm has few rules to calculate distance between phrases. For strings A and B those rules are:
- If length of A is equal to 0 then distance is equal to the length B.
- If length of B is equal to 0 then distance is equal to length A.
- If first character of A is equal to the first character of B then skip them and analyze distance for the rest of characters.
- Now comparison occurs. First add 1 to the distance and add the best operation from the list:
- remove one element from A,
- insert one element to A,
- replace one element in A with element from B.
Based on those rules we can calculate distances between words shark, trans, mark:
Transform shark to trans
- S H A R K <-> T R A N S (distance = 0)
- T H A R K <-> T R A N S (distance = 1) -> replace
- T R A R K <-> T R A N S (distance = 2) -> replace
- T R A N K <-> T R A N S (distance = 3) -> replace
- T R A N S <-> T R A N S (distance = 4) -> replace
Transform shark to mark
- S H A R K <-> M A R K (d = 0)
- (0) H A R K <-> M A R K (d = 1) -> remove
- M A R K <-> M A R K (d = 2) -> replace
Transform mark to trans
- M A R K <-> T R A N S (d = 0)
- T M A R K <-> T R A N S (d = 1) -> insert
- T R A R K <-> T R A N S (d = 2) -> replace
- T R A N K <-> T R A N S (d = 3) -> replace
- T R A N S <-> T R A N S (d = 4) -> replace
Algorithm implementation which is fast is not a straightforward process. Fortunately there’s Python package fuzzywuzzy dedicated to calculate a distance between words. Let’s use it!
Project plan
Our project is divided into following sections:
- Preparation of
condaenvironment. - Download data from the webpage.
- Data cleaning.
- Levenshtein Distance function.
DataFramefor the analysis.- Exploratory Data Analysis: bar plots.
- Comparison of all records altogether.
- Similarity map of records.
Main takeoffs from this article are:
- you will build a system which scrapes data from the webpage (
requests,BeautifulSoup), - you will perform exploratory data analysis on the set of words (
fuzzywuzzy,pandas), - you will learn which data presentation methods are the best for this case (
matplotlib,seaborn).
Project: Match online text and check similarity of the words
Project is divided into multiple parts. If you are not interested in some of them then move to the next section. Those parts are loosely depended on each other.
Part 1: Environment preparation
Before we start we must have anaconda (conda, miniconda) environment installed in our system. With it we can setup our working environment. We are going to create environment named stringmatch with seven dependencies:
conda create -n stringmatch -c conda-forge fuzzywuzzy pandas requests beautifulsoup4 matplotlib seaborn notebook
To activate environment type:
conda activate stringmatch
And to run Jupyter Notebook type:
jupyter-notebook
… and create new notebook.
Part 2: Download data from the webpage
To make tutorial more interesting we use external data source for our work. It simulates our dependency on the records from database. We use prepared list of words from HERE.
Working with data from the HTML pages is a tricky thing. We must be aware that the structure of HTML may change over time and the good practice is to monitor if it is the same over and over again when we are scraping page content. Very simple approach is to check if some kind of headers or div elements are present in the webpage. We will do it in this step, along with data downloading. In summary we are going to:
- test connection to the webpage,
- check changes in the webpage content,
- download dataset for analysis.
All of it is possible with requests Python package. Let’s go! We start with package import and with setting up our first constant – webpage url:
import requests

WEBPAGE_URL = 'https://ml-gis-service.com/index.php/teaching/'
Just few words about the requests package capabilities. I bet that you had seen 404 error in the past. There is a possibility that you’d seen 502 error too. Those two kinds of errors informs us that something is wrong. With 4XX errors – there is something wrong with the webpage on our side (maybe wrong url?) and errors from the 5XX family are related to backend issues (maybe database connection is lost?). If you build any system which automatically crawls over internet then be aware that the connection error handling is a must-have skill. Requests package has few internal exceptions which we can use to catch those errors. The good practice is to download page content within try ... except ... statement and if error occurs then log it to the admin. Here’s example how to open connection to the webpage given in a WEBPAGE_URL variable with error handling in mind:
# Always monitor connections!
# https://requests.readthedocs.io/en/latest/user/quickstart/#errors-and-exceptions

try:
    page = requests.get(WEBPAGE_URL)
except requests.exceptions.Timeout:
    print('Info: page is not available now...')
except requests.exceptions.TooManyRedirects:
    print('Info: probably url has changed...')
except requests.exceptions.RequestException as e:
    raise SystemExit(e('Critical Error!'))
Is page loaded successfully? If any of those print statements don’t work that we are at the right path! To test it better we can use status_code attribute of our requests.models.Response object:
page.status_code
200
Status code equal to 200 means that our connection is fine and we can start to dig in within the page.
(Optional) Check page content
You may skip this step – it’s optional. Treat it as a good advice. Successful connection is the initial step of checks (if we build automated system). The next step is to look into structure of the HTML document which we are going to scrap. Chances that something has changed in the website code are pretty high and a good practice is to monitor all elements from the HTML tags, especially id and classes and a DOM structure of a document. In this example we can do it very simply by monitoring if specific kind of header tag with specific text exists in the scraped document (it is my webpage and I don’t plan to change or remove this specific header). How to do it? Very simple: get full document as bytes type from the requests package then find specific HTML tag <h2></h2> with BeautifulSoup. If those tags exist then check text within them and if any of phrases is equal to Data Science workshops materials then we are in a good place:
def check_page_tag(page_content, tag_type, unique_text):
    """
    Function performs check if we're connected to the right page
    based on the header value. Method raises IOError if header is
    not detected.

    :param page_content: (bytes) output of requests package,
    :param tag_type: (str) HTML tag type to check
    :param unique_text: (str) unique text inside tag_type element from the page

    """
    page_content = str(page_content)
    error_message = f'You\'ve not connected to the service.\n\
    HTML tag {tag_type} of value "{unique_text}" wasn\'t detected.'

    headers = soup.find_all(tag_type)

    # Now we can terminate if there are no headers
    if not headers:
        raise IOError(error_message)
    else:
        # Check if unique header exist
        headers_text = [h.get_text() for h in headers]

        if not unique_text in headers_text:
            raise IOError(error_message)


from bs4 import BeautifulSoup


WEBPAGE_HEADER = 'Data Science workshops materials'

soup = BeautifulSoup(page.content, 'html.parser')
check_page_tag(page.content, 'h2', WEBPAGE_HEADER)
If function check_page_tag() doesn’t return error then everything is fine and we can retrieve data. We use BeautifulSoup for this task. First, parse bytes from requests to soup object type:
soup = BeautifulSoup(page.content, 'html.parser')
Next soup object, or parsed document, is passed into the function check_page_tag(). Within this function we use other specific method of BeuatifulSoup package .find_all() which scans parsed document and return list of specific tag elements. Then for each tag we extract text with .get_text() method and compare it to the unique_text parameter. IOError is returned if unique_text isn’t found anywhere.
This is a very simple implementation of a function which scans webpage to find any structural changes. In reality it will be more complex, especially with pages loaded dynamically. (Keep this in mind!)
Now we are returning to our baseline path. We are going to retrieve text for distance calculation.
Data Transformation with BeautifulSoup
Part 2 of the article is a complicated way to retrieve data. In reality we use database with clear schema or flat file. But HTML document has its structure too and this non-trivial data preparation task teaches us how to handle boundary conditions within projects. Take a look into source code of the webpage HERE. Words used in this tutorial are presented as a bullet list. Bullet list tag is <li></li>. The case here is to obtain concrete list with specific words without tags.
But here’s a problem, if we just take all <li></li> elements with the .find_all() method from BeautifulSoup we get:
words_candidates = soup.find_all('li')
print(words_candidates)
[<li class="menu-item menu-item-type-post_type menu-item-object-page narrow" id="nav-menu-item-87"><a class="" href="https://ml-gis-service.com/index.php/about/"><span class="item_outer"><span class="item_inner"><span class="item_text">Author</span></span></span></a></li>, <li class="menu-item menu-item-type-post_type menu-item-object-page current-menu-item page_item page-item-121 current_page_item mkd-active-item narrow" id="nav-menu-item-124"><a class="current" href="https://ml-gis-service.com/index.php/teaching/"><span class="item_outer"><span class="item_inner"><span class="item_text">Teaching</span></span></span></a></li>, <li class="cat-item cat-item-2"><a href="https://ml-gis-service.com/index.php/category/data-engineering/">Data Engineering</a> </li>, <li class="cat-item cat-item-18"><a href="https://ml-gis-service.com/index.php/category/data-science/">Data Science</a> </li>, <li class="cat-item cat-item-19"><a href="https://ml-gis-service.com/index.php/category/machine-learning/">Machine Learning</a> </li>, <li class="cat-item cat-item-50"><a href="https://ml-gis-service.com/index.php/category/management/">Management</a> </li>, <li class="cat-item cat-item-48"><a href="https://ml-gis-service.com/index.php/category/personal-development/">Personal Development</a> </li>, <li class="cat-item cat-item-3"><a href="https://ml-gis-service.com/index.php/category/python/">Python</a> </li>, <li class="cat-item cat-item-49"><a href="https://ml-gis-service.com/index.php/category/rd/">R&D</a> </li>, <li class="cat-item cat-item-4"><a href="https://ml-gis-service.com/index.php/category/raster/">Raster</a> </li>, <li class="cat-item cat-item-20"><a href="https://ml-gis-service.com/index.php/category/remote-sensing/">Remote Sensing</a> </li>, <li class="cat-item cat-item-17"><a href="https://ml-gis-service.com/index.php/category/scripts/">Scripts</a> </li>, <li class="cat-item cat-item-30"><a href="https://ml-gis-service.com/index.php/category/spatial-statistics/">Spatial Statistics</a> </li>, <li class="cat-item cat-item-31"><a href="https://ml-gis-service.com/index.php/category/tutorials/">Tutorials</a> </li>, <li class="menu-item menu-item-type-post_type menu-item-object-page" id="mobile-menu-item-87"><a class="" href="https://ml-gis-service.com/index.php/about/"><span>Author</span></a></li>, <li class="menu-item menu-item-type-post_type menu-item-object-page current-menu-item page_item page-item-121 current_page_item mkd-active-item" id="mobile-menu-item-124"><a class="current" href="https://ml-gis-service.com/index.php/teaching/"><span>Teaching</span></a></li>, <li>time</li>, <li>year</li>, <li>people</li>, <li>way</li>, <li>day</li>, <li>man</li>, <li>thing</li>, <li>woman</li>, <li>life</li>, <li>child</li>, <li>world</li>, <li>school</li>, <li>state</li>, <li>family</li>, <li>student</li>, <li>group</li>, <li>country</li>, <li>problem</li>, <li>hand</li>, <li>part</li>, <li>place</li>, <li>case</li>, <li>week</li>, <li>company</li>, <li>system</li>, <li>program</li>, <li>question</li>, <li>work</li>, <li>government</li>, <li>number</li>, <li>night</li>, <li>point</li>, <li>home</li>, <li>water</li>, <li>room</li>, <li>mother</li>, <li>area</li>, <li>money</li>, <li>story</li>, <li>fact</li>, <li>month</li>, <li>lot</li>, <li>right</li>, <li>study</li>, <li>book</li>, <li>eye</li>, <li>job</li>, <li>word</li>, <li>business</li>, <li>issue</li>, <li>side</li>, <li>kind</li>, <li>head</li>, <li>house</li>, <li>service</li>, <li>friend</li>, <li>father</li>, <li>power</li>, <li>hour</li>, <li>game</li>, <li>line</li>, <li>end</li>, <li>member</li>, <li>law</li>, <li>car</li>, <li>city</li>, <li>community</li>, <li>name</li>, <li>president</li>, <li>team</li>, <li>minute</li>, <li>idea</li>, <li>kid</li>, <li>body</li>, <li>information</li>, <li>back</li>, <li>parent</li>, <li>face</li>, <li>others</li>, <li>level</li>, <li>office</li>, <li>door</li>, <li>health</li>, <li>person</li>, <li>art</li>, <li>war</li>, <li>history</li>, <li>party</li>, <li>result</li>, <li>change</li>, <li>morning</li>, <li>reason</li>, <li>research</li>, <li>girl</li>, <li>guy</li>, <li>moment</li>, <li>air</li>, <li>teacher</li>, <li>force</li>, <li>education</li>]
That’s terribly wrong! We obtained a lot of garbage… But we can investigate closer <li></li> tags and check for something which can be used to distinguish thrash from the important words. There’s something. Or maybe there isn’t! <li></li> tags with a words from the list are not members of any class. And we can utilize this fact. Method .find_all() has class_ parameter. If we set it to None then function parses only those elements which are not members of any class:
words_candidates = soup.find_all('li', class_=None)
Great! Now we are limited to the list of simple English nouns. To retrieve text only, without tags, we use .get_text() method and a list comprehension:
words = [x.get_text() for x in words_candidates]
Excellent! Our corpus of sample English words is prepared to the most important step.
Part 3: Distance from words to sample word
Now we have everything to move with the data science algorithms. Let’s start the implementation with the sample English word. In my case it is shark but you should choose other word. Create variable with your word and import fuzz module from fuzzywuzzy package:
from fuzzywuzzy import fuzz

SAMPLE = 'shark'  # you should create other word
Distance calculation function
We have multiple words to compare and usually we have multiple records in a database to check. That’s why it is better to write small function which iterates through words and creates array of distances to any given sentence:
def find_distance(word, list_of_words):
    """
    Function calculates Levenshtein Distance between given word
    and other words.

    :param word: (str) single word to test distance from it to other
        words,
    :param list_of_words: (list) list of other words to compare

    SAMPLE
    :return: (list) list of distances from a given word to other words,
        position of each distance is the same as other words indexes.
    """

    distances = []
    for single_word in list_of_words:
        distance = fuzz.ratio(word, single_word)
        distances.append(distance)
    return distances

distances = find_distance(SAMPLE, words)
If we plot distances[:3] we can check first three results:
[0, 44, 0]
Result list do DataFrame
Python list is not the best object for analytics. We get distances but those are only single values assigned to specific words by index in the list which can lead to mistakes and errors with further data handling. The better idea is to create human-friendly structure which preservers information about words. The best idea is to build DataFrame from our results. We have all information for this transformation: data as a list of distances; index as a list of words; and we have only single column – chosen word – which we will pass into columns parameter of DataFrame:
import pandas as pd

df = pd.DataFrame(data=distances, index=words, columns=[SAMPLE])
Now we can perform fast analysis, as example filtering based on the distance value:
df[df[SAMPLE] >= 50]
| shark | |
| car | 50 |
| art | 50 |
| war | 50 |
| air | 50 |
Bar plot of distances
To make things more pleasant for the human viewer we will plot results as a bar plot in the seaborn package. Not all distances are important from an analyst perspective. In reality we are more interested in similar words than dissimilar. To make plot clean we write helper function which transforms passed DataFrame. Function should limit results to those greater than lower_thresh limit and it should sort values from the biggest to the smallest.
import matplotlib.pyplot as plt
import seaborn as sns

def plot_bars(bardata, column_to_plot, lower_thresh=20):

    ndf = (bardata[bardata[column_to_plot] > lower_thresh]).sort_values(
        column_to_plot, ascending=False)

    plt.figure(figsize=(14, 6))
    sns.barplot(x=ndf.index,
                y=ndf[column_to_plot],
                hue=ndf[column_to_plot],
                palette="rocket",
                dodge=False)
    plt.xticks(rotation=90)
    plt.title(f'Distance from the word {column_to_plot} to other words')
    plt.show()

plot_bars(df, SAMPLE)
I got this plot:
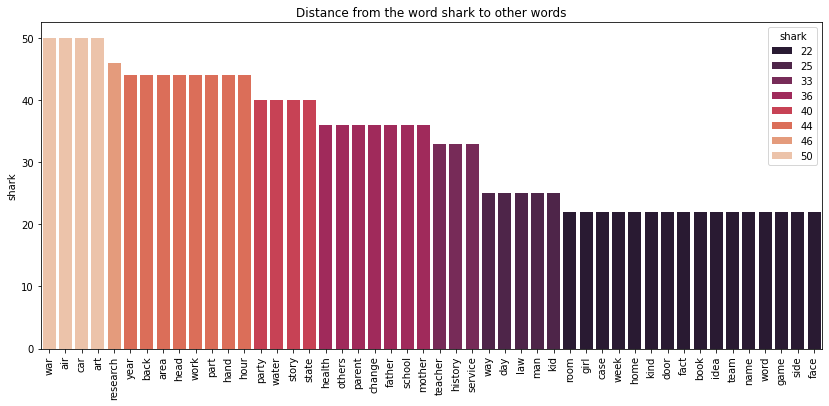
Is it clearer? Plot like this may be used in the report for client or business division of our company.
Part 4: Distance between all words
Part 3 of the article was a warm-up. Meaningful task is to write a pipeline which compares each record with each other record in a database and that’s how we try to match records which are describing the same object but in a slightly different way. DataFrame is a nice simulation of relational database table. Let’s create it. This time its structure resembles the matrix graph representation of a data where each word is a node, and we assume that all nodes are connected with other nodes and weights of connection is set as a distance between words.
| car | cat | |
| car | 100 | 67 |
| cat | 67 | 100 |
Distance to the same word is equal to 100 (closes word) and each diagonal record will have this distance. Created matrix is symmetric: value in position [i][j] is equal to value in position [j][i]. To create it we simply initiate a new DataFrame with columns and index the same as our list of words. (Remember to append to this list your sample word before you create a DataFrame).
words.append(SAMPLE)  # append sample word
df = pd.DataFrame(index=words, columns=words)  # Create new DataFrame
df.head()
| time | year | people | … | |
| time | NaN | NaN | NaN | NaN |
| year | NaN | NaN | NaN | NaN |
| people | NaN | NaN | NaN | NaN |
| … | NaN | NaN | NaN | NaN |
Next we iterate through each [row, column] in a table and calculate ratio of two words. We add two conditions to the loop:
- If name of column is the same as the name of row then algorithm does not do anything (
NaNvalue stays – we are not interested in the same words). - If value at
[row, column]isNaNandvalue at[column, row]isNaNthen we assign Levenshtein distance at those places. This is symmetric matrix so calculation may be done once.
We create two for loops and iterate through each word to assign distance to the specific cell in the output matrix. With condition 2. we can speed up algorithm and perform calculations only one time and not twice.
for w_ in words:
    for _w in words:
        if w_ == _w:
            pass
        else:
            # Check if value has been set already
            if pd.isna(df.at[w_, _w]) and pd.isna(df.at[_w, w_]):
                distance = fuzz.ratio(w_, _w)
                df.at[w_, _w] = distance
                df.at[_w, w_] = distance

df.head()
| time | year | people | … | |
| time | NaN | 25 | 20 | … |
| year | 25 | NaN | 20 | … |
| people | 20 | 20 | NaN | … |
| … | … | … | … | NaN |
We can filter this table and search for the most similar word pairs. Standard pandas operations are enough for it but to make things more interesting we are going to build heat map of similarity. It is a beautiful graph. Maybe not so informative if we deal with a lot of words but it can be a useful tool for reporting.
plt.figure(figsize=(14, 12))
sns.heatmap(df.astype(float), linewidths=1)
plt.show()

Summary
In this article we’ve uncovered techniques to match different words with fuzzywuzzy package in Python. Bonus takeaways are web scraping techniques with requests and data visualization techniques with seaborn. Hope that you’ll use those things in your projects!
Links
Notebook with code presented in the article is available here: https://github.com/szymon-datalions/articles/tree/main/2021-05/fuzzywuzzy

