Toolbox: Get Bounding Box Polygon and centroid of a point cloud in Python
August 15, 2022
Let’s assume that we have a set of points, for example:
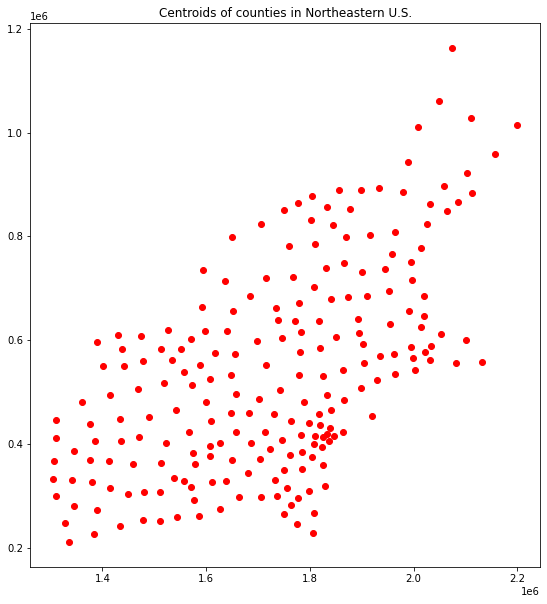
And we would like to get their Bounding Box and its centroid. How do we achieve it? We can use shapely and GeoPandas packages for it!
from typing import Union

import geopandas as gpd
from shapely.geometry import Polygon


def points_to_bounding_box(points: Union[gpd.GeoSeries, gpd.GeoDataFrame]):
    """
    Function transform a set of points into a Polygon with bounding box.

    Parameters
    ----------
    points : gpd.GeoSeries

    Returns
    -------
    bounding_box : Polygon
    """
    bounds = points.total_bounds

    x_min, y_min, x_max, y_max = bounds

    polygon_tuples = [
        (x_min, y_min), (x_max, y_min), (x_max, y_max), (x_min, y_max)
    ]

    polygon = Polygon(polygon_tuples)
    return polygon


poly = points_to_bounding_box(centroids)
print(poly)
POLYGON ((1305267.3457557156 210560.55098878054, 2198938.029283345 210560.55098878054, 2198938.029283345 1163583.8925663661, 1305267.3457557156 1163583.8925663661, 1305267.3457557156 210560.55098878054))
If we want to get a centroid, then we can use the centroid attribute of Polygon structure:
print(poly.centroid)
POINT (1752102.6875195305 687072.2217775733)
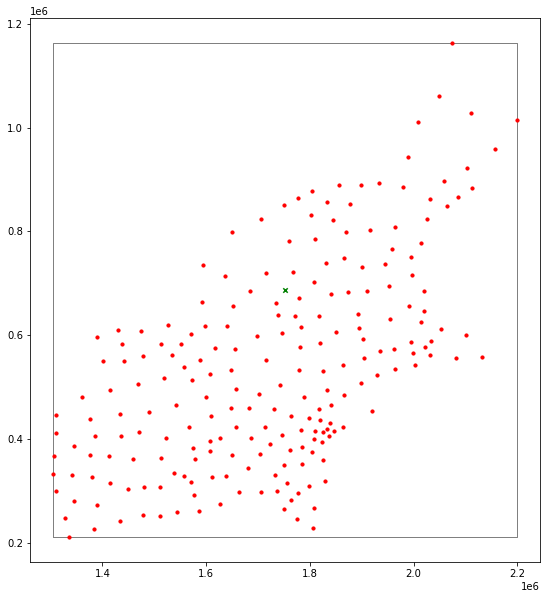
Plotting all together can be a little bit tricky – we must change simple geometries into GeoSeries objects, and then we can plot our output:
bb = gpd.GeoSeries(poly)
bb.set_crs(crs=centroids.crs)  # Here we must set CRS of our baseline set of points!

cent = bb.centroid  # We can generate centroid from GeoPandas GeoSeries object

# Plot

base = bb.plot(color='white', edgecolor='gray', figsize=(12, 10))
centroids.plot(ax=base, marker='o', color='red', markersize=10);
cent.plot(ax=base, marker='x', color='green', markersize=20)
plt.show()


Subscribe
Login
0 Comments
Oldest