Toolbox: K-means algorithm
K-means is the basic unsupervised learning technique. This algorithm is an excellent choice for spatial data clustering or the initial analysis and the categorization of the customers base. K-means is an unsupervised algorithm, and we cannot easily say how many groups there should be. So the experiment is usually performed over multiple groups, and based on the model inertia and the silhouette score, we choose the final number of groups. Class implemented in this article does all of those tasks. It:
- performs multiple experiments over a different number of groups,
- stores inertia and silhouette scores,
- shows inertia and silhouette score per number of clusters.
Here is the implementation:
import numpy as np
import pandas as pd
import matplotlib.pyplot as plt


class ClusteredData:

    def __init__(self, dataset: pd.DataFrame):
        self.ds = dataset
        self.no_of_ranges = None
        self.models = []
        self.predicted_labels = {}
        self.s_scores = []
        self.inertia_scores = []

    def build_models(self, no_of_clusters_range: list, update_input_labels=True):
        self.no_of_ranges = no_of_clusters_range
        for n_clust in no_of_clusters_range:
            kmeans = KMeans(n_clusters=n_clust)
            y_pred = kmeans.fit_predict(self.ds)

            # Append model
            self.models.append(kmeans)

            # Calculate metrics
            self.s_scores.append(self._calc_s_score(y_pred))
            self.inertia_scores.append(kmeans.inertia_)

            # Append output (classified)
            if update_input_labels:
              self.predicted_labels[n_clust] = y_pred

    def _calc_s_score(self, labels):
        s_score = silhouette_score(self.ds, labels, sample_size=1000)
        return s_score

    def show_inertia(self):
        plt.figure(figsize = (10,10))
        plt.title('Inertia of the models')
        plt.plot(self.no_of_ranges, self.inertia_scores)
        plt.show()

    def show_silhouette_scores(self):
        plt.figure(figsize = (10,10))
        plt.title('Silhouette scores')
        plt.plot(self.no_of_ranges, self.s_scores)
        plt.show()
And invoking:
models = ClusteredData(scaled_data)  # Remember to scale and normalize data
ranges = np.arange(4, 21)
models.build_models(ranges)
models.show_inertia()
models.show_silhouette_scores()
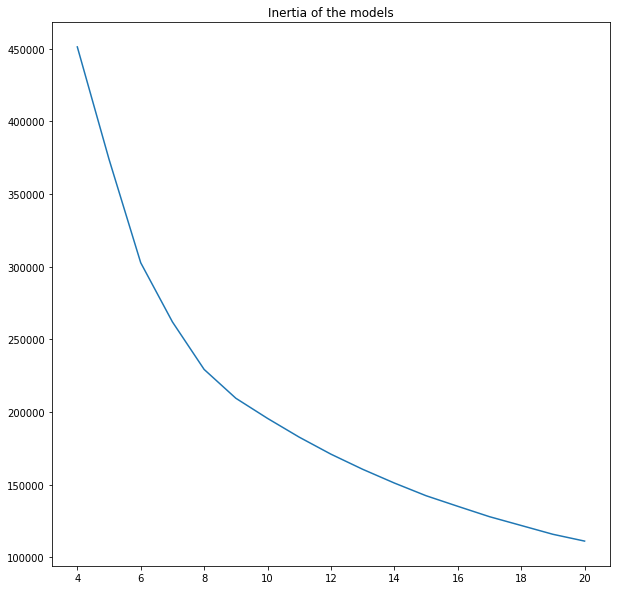
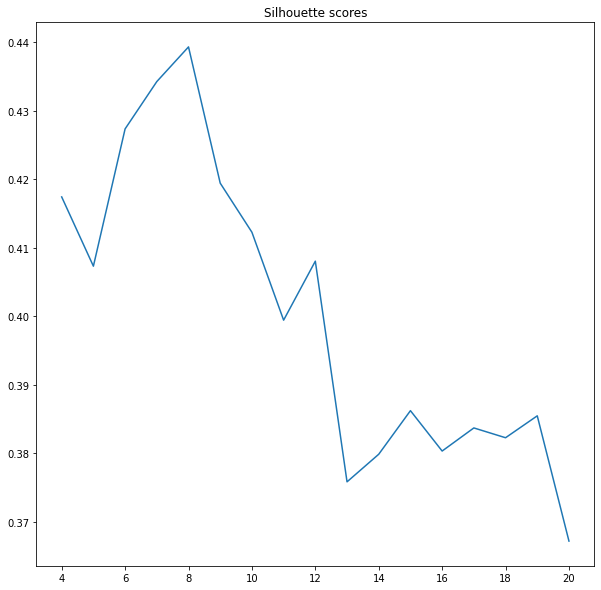
Note: we may wonder what those graphs tell us about the clusters? Looking at the inertia is hard to say at which point the curve breaks. Thus, we will check the silhouette score. It is a normalized index between +1 and -1. A value close to +1 indices that our clusters are not overlapping and data is easily clustered. A value close to -1 signifies chaos, groups are overlapping, and labels are chosen randomly. Our task is to select several clusters with reasonably high silhouette scores. In this context, it is 8-10 clusters. We are ready for further analysis!