Spatial Interpolation 101: Variance and Dataset Dimensions
Variance is the backbone of statistical analysis.
<< Previous part: Spatial Interpolation 101: Introduction to the semivariance concept, basic statistics review
The semivariance is a crucial concept of spatial statistics. We’ve made initial steps to understand it in the previous article when we discovered basic statistical parameters: the mean and the standard deviation. Here we are going a step further, and we look into the variance.
TAKEAWAYS FROM THIS ARTICLE
- The variance – why it is important and why it isn’t?
- Spatial datasets: properties.
Dimensions
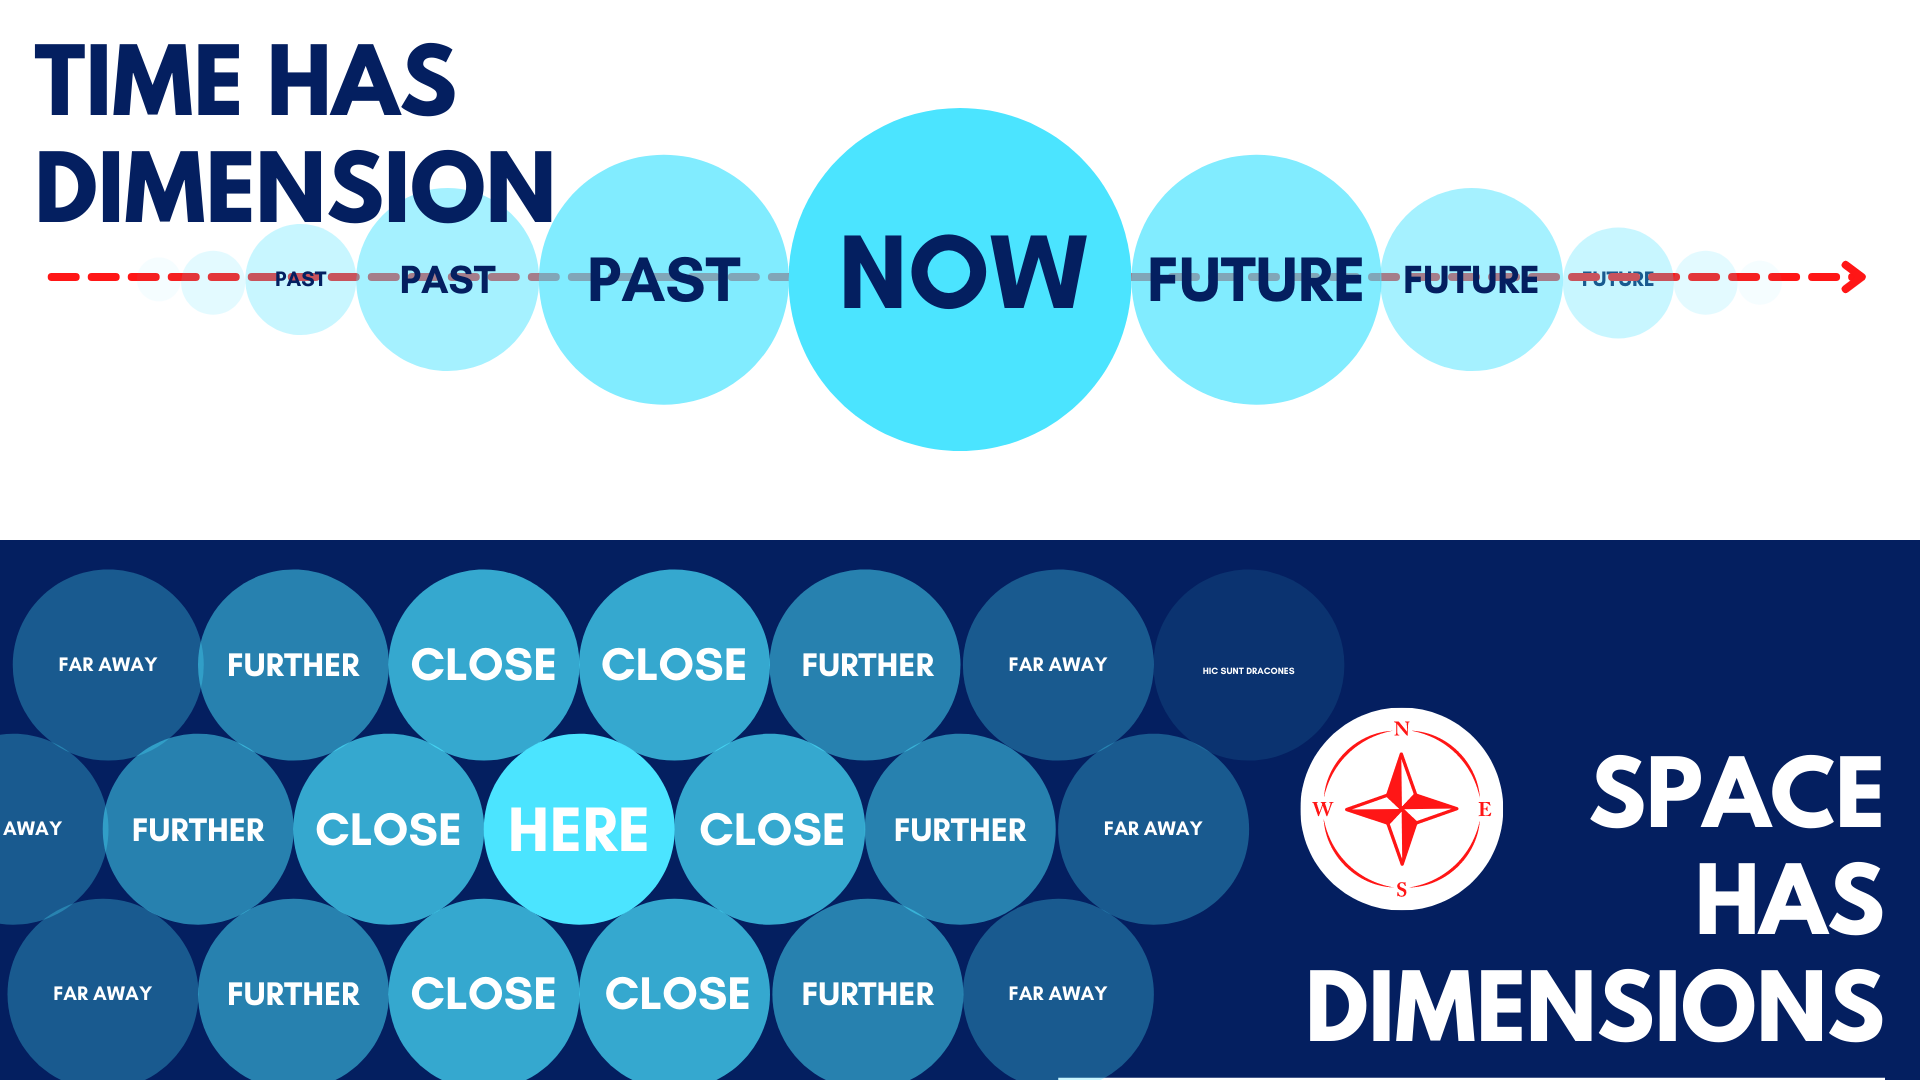
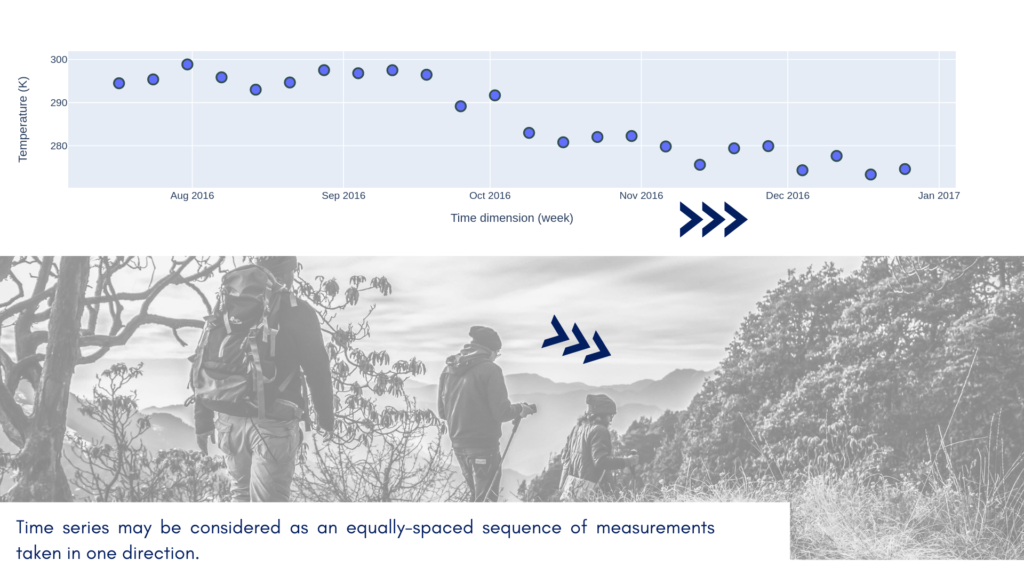
It’s easier to understand theoretical concepts with real-world data. In this article, we will analyze a time series. Why time series? This kind of data is relatively easy to understand. It has an excellent property; it has the dimension. We can treat time as a line in a space where one dimension is fixed and the other changes in equal intervals. Let’s imagine that you stand on the meridian 0° and go north along with it. You read temperature every 10 kilometers and store results as one sequence. Congratulations, you’ve created your first series! You can put latitudes along the x-axis and temperature along the y-axis, and you should get a plot very similar to the time series. This additional dimension is a treasure for an analyst. We observe how neighbors affect each other and we can discover on how long distances they do so!
Geostatistics uses the fact that measurement coordinates pair (place) is a carrier of the supplementary context about data. The time series analysts think the same about timestamps. What happened a moment ago has made a large chunk of the present; what is close is more similar than the things a long distance away.

I hope that we are on the same page and ready to do some math. To make things more accessible, I’ve trimmed data only to the July-December 2016 period, and I’ve transformed dates into timestamps.
The neighborhood dependence is visible, and close measurements are usually similar. But how do we quantize this similarity? We will divide these questions into two parts: how do we measure similarity across samples, and how do we calculate similarity across space (or time). The first part is a topic of the current lesson, the second question will be answered in the next part of a series.
Variance
Do you remember the standard deviation from the previous blog post? It was a measure of the dispersion of observations. We use it to uncover the variability in our dataset and how close our measurements are to the expected value. Variance has the same role, but it represents a square of standard deviation. Standard deviation was calculated as:
$$\sigma = \sqrt{\frac{1}{N – 1} * \sum_{i=1}^N{(x_{i} – \bar{x})^2}}$$ (1)
and it is a square root from the sum of variances divided by the number of samples minus one. So we know how to get a variance of a dataset! It is simply:
$$V = \frac{1}{N} * \sum_{i=1}^N{(x_{i} – \bar{x})^2}$$ (2)
There are two differences: we take all samples ($N$) into the denominator, and we do not transform the output value. It is the square of the sum of the errors. Where error is a difference between observed value $x_{i}$ and the expected value (mean) $\bar{x}$. As you probably noticed, variance is always positive. It is harder to link variance with data because its range differs from data units. That’s why we prefer standard deviation to describe data properties. Variance is used mostly in statistical calculations as an intermediate step of the analysis.
Task
Look into a temperature plot and guess:
- The value of standard deviation,
- The value of variance.
Compare those values to the actual results (in the text below).
The standard deviation, or dispersion from the mean, is close to 9 degrees. It is easily explainable: if we take random value from our dataset, there is a 68% chance (1 standard deviation) that it will be within the interval [mean – 9 : mean : mean + 9]. The variance is close to 80 square units.
Did we miss something here?
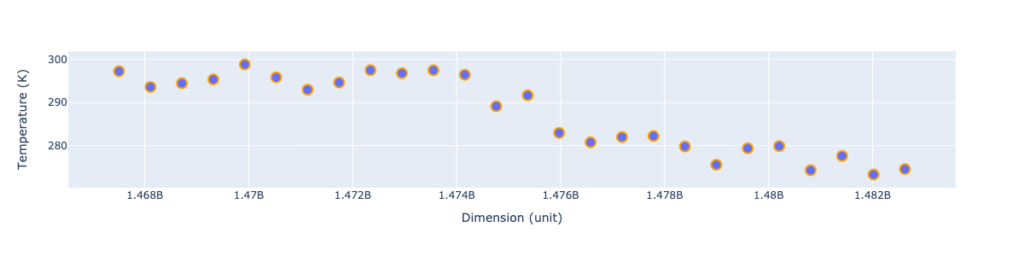
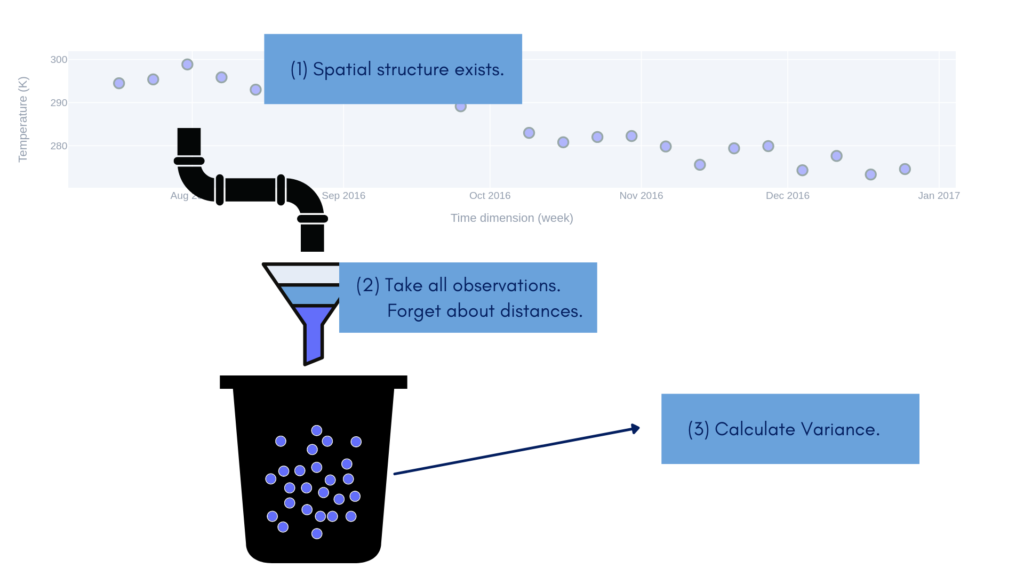
The fact that we have calculated variance but didn’t consider the dimension. Our analysis is dimensionless. Is it pointless? Not at all. But we cannot use information about global variance to estimate unknown values a few steps ahead. Figure 4 shows this process conceptually: we scrap data from its dimension, throw scrapped values into a bucket and calculate the variance from those.
We shouldn’t think that variance is useless in the context of spatial data. We need it to compare the covariance and semivariance of our dataset… And we will do it in the next parts of a tutorial.
Exercises:
- Write a function to calculate the variance of a given array. Try to avoid built-in methods. Use your favorite programming language.
- Expand your function to calculate the variance of the parts of an array, where the sample from the array is equal to the length n. The minimal window size should be three (3.), and the function should return k-n+1 results, where k is a number of samples in your array. Each window of n samples should be moved step by step up to the end of the sequence. Hint: Let’s consider an array of values
[1, 2, 3, 4, 5, 6]and window size3. In the first step, the algorithm calculates variance for[1, 2, 3], in the next step, it calculates variance from values[2, 3, 4], then[3, 4, 5], and at the end[4, 5, 6]. The algorithm returns an array of four variances. We will start the next lesson with a solution to this problem.
Changelog
- 2022-02-19: The first release