Spatial Epidemiology: Baltic Sea and Algal Blooms – how to get data?
Heat wave just arrived. We stay in a shadow, but it doesn’t protect us from the sweating, even here is 30 degrees C (90 F). Fortunately for us, there is a cold breeze from the sea. We know that soon we will jump into a cold water and hide beneath the waves from the scorching sun. But something is wrong. We arrive to the beach, and we see that there are red flags, all along sea line. We’ve checked weather forecast and we know, that those flags aren’t indicating upcoming storm. Baltic Sea is free from sharks and jellyfishes. So what’s going on? After a while we start to smell the problem. It is an algal bloom that has covered water in a rotten, green and sticky layer. This day is not our day and we probably won’t be able to swim…
Algal Bloom brings death
You should be happy if you have never heard of harmful algal blooms. This is a recurring disaster for societies that live along the coast or near big lakes. A relationship between agricultural fertilizers and climate change leads to the event known as the harmful algal blooms [1].
What are the consequences of HABs?
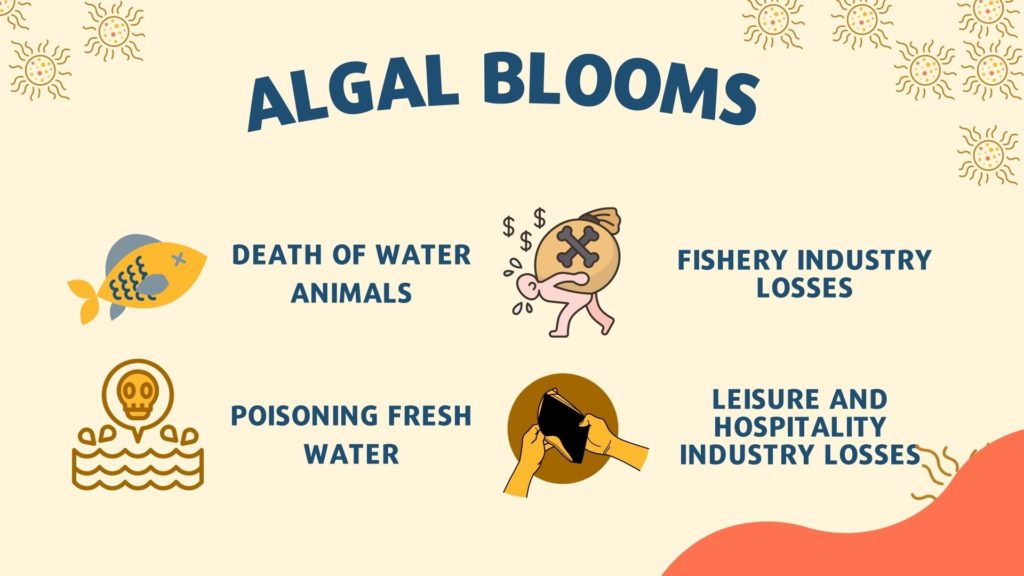
- Death of a water fauna. The algal layer sucks a lot of oxygen from water and other organisms die or suffer from hypoxia.
- If fishes or shellfishes die in a great number, then the fishery industry will be not profitable.
- Toxic or just smelly water doesn’t help when our business is based on tourists that want to take advantage of the sea…
- And the last but not least, toxins from algal blooms are deathly. Some of them are the strongest toxins in the world. Moreover, those toxins tend to deposit in the bodies of sea animals that we eat. This way, we can eat a large amount of poison, which wouldn’t be possible if we just accidentally take a sip of contaminated water.
Let’s take a closer look into organisms and their toxins that are common in our seas and lakes [2; 3]:
| Organism | Water Type | Bloom color | Toxin | Damaged tissues | Health effects |
| Alexandrium sp. | Salt | Red / Brown | Saxitoxins – one of the strongest toxins in nature [4] | Nerves and muscles | Paralytic shellfish poisoning, paralysis, death, respiratory system failure |
| Karenia Brevis | Salt | Red | Brevetoxins | Nerves and muscles | Gastrointestinal illness, muscle cramps, paralysis, respiratory problems |
| Pseudo-nitzschia | Salt | Red / Brown | Domoic acid | Nervous system | Initial phase: gastrointestinal illness. Developed stage: long-lasting or permanent short-term memory loss (amnesia), confusion, seizures, and in rare cases death |
| Microcystis | Fresh | Blue / Green | Microcystin | Liver | Liver damage |
| Nodularia | Salt | Blue / Green | Nodularin | Liver | Liver damage, carcinogenic agent [5] |
The irony is that the algae (cyanobacteria) are everywhere, in each type of water. Algal blooms are a worldwide issue. There is a chance that a big lake or sea that you have seen is a place where blooms occur. Moreover, they are one of the oldest organisms on Earth, we found their fossils dated 3.5 billion years back [6]. Under normal circumstances, algae are not harmful at all. But we suspect that overnutrition with agricultural fertilizers and climate change lead to the overgrowth of algae [7].
Algal Blooms Analytics
Is it easy to obtain data for Algal Bloom analytics? Luckily for us, yes, it is!
It’s easier than you think and there are multiple ways to do it, even without stepping out outside! We will go through an example from Gdansk Bay on the Baltic Sea but the same steps may be repeated for other water reservoirs. A great source of information about local disasters is the local news portal. For Gdansk Bay area it is Trójmiasto.pl (eng.: Trójmiasto = Tricity => Gdansk + Sopot + Gdynia). Let’s take a look at how many times per year the phrase sinice (eng.: algae) has appeared in articles. Every news portal has a past articles browser [A], and we can take advantage of it! Here are the results of a search:
- 2001 | 1
- 2002 | 1
- 2003 | 4
- 2004 | 1
- 2005 | 1
- 2006 | 1
- 2007 | 0
- 2008 | 1
- 2009 | 3
- 2010 | 1
- 2011 | 2
- 2012 | 6
- 2013 | 1
- 2014 | 2
- 2015 | 6
- 2016 | 3
- 2017 | 0
- 2018 | 11
- 2019 | 5
- 2020 | 1
- 2021 | 3
The list shows a specific pattern. First of all, the average number of articles per year increases. And we can see, that there is some kind of cyclic behavior. Every three years from 2009 we have a peak. Are those patterns artifacts? Many articles were indirectly related to the algal blooms, so maybe this data is not representative? We can dig deeper with another data source: Google Trends. We can ask the browser about sinice in Poland and it will return a weekly number of searches with this word (normalized to values 0-100) [B]. To make the output more meaningful we select only Pomeranian voivodship (state) where Gdansk Bay is located. Let’s compare normalized results from Trends and Trojmiasto.pl:
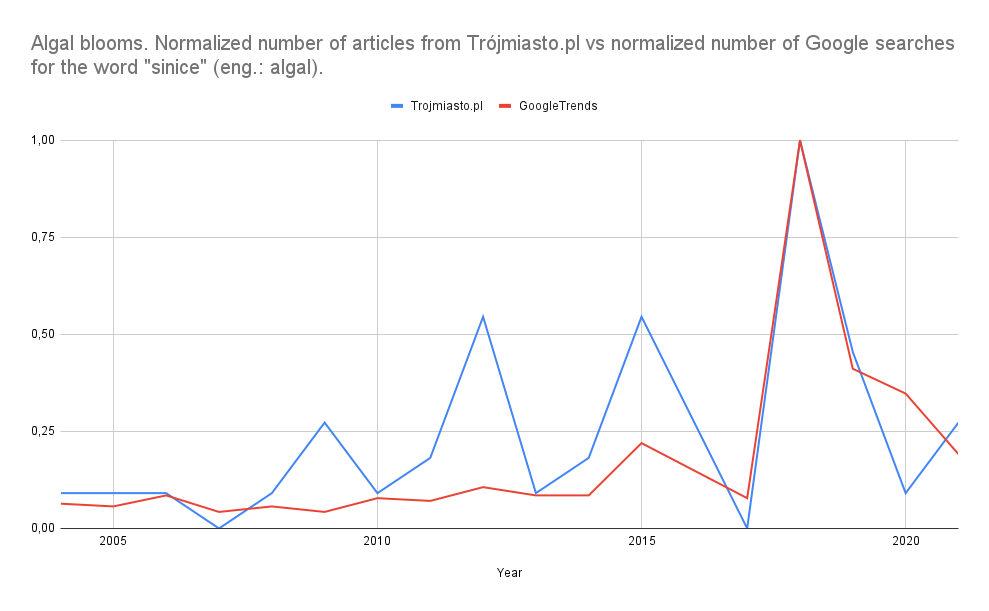
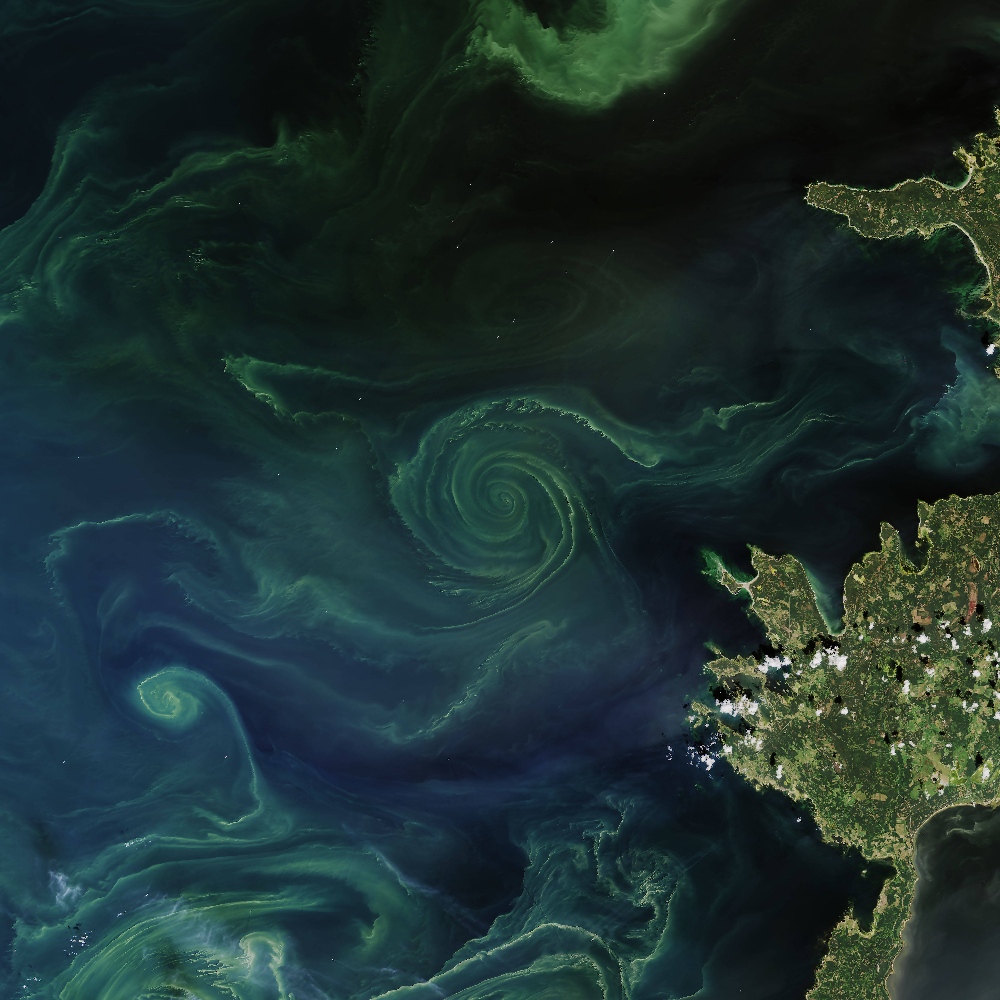
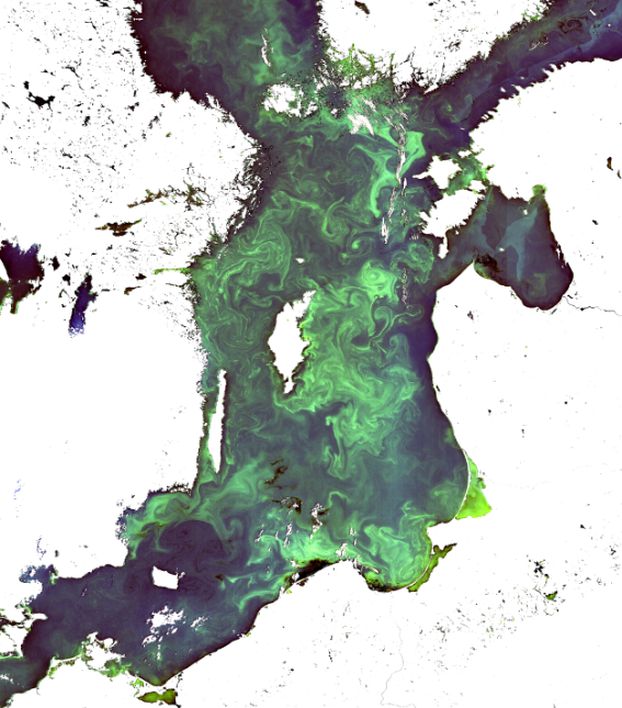
sinice (eng.: algae). C: Szymon Moliński.A cyclic pattern repeats itself for both data sources, especially for 2012:2015:2018. The trend is visible for those datasets too, but it is much weaker than cyclic rises of amplitude. I don’t know why this 3-year pattern exists, but what I know, is that in 2018 Poland and the Baltic Sea were trapped in a heat wave for many weeks. The Baltic Sea had toxic, green color this year:
Maybe you don’t trust indirect data sources. There is good news for you: we can still explore algal blooms without moving from our computers! Based on the latest images we know, that satellites can capture algal blooms from space. There are free and open satellite images that we can use for the analysis: Landsat 5-9, Sentinel 2 and 3. Let’s take a look at the Landsat 8 scene of Gdansk Bay:
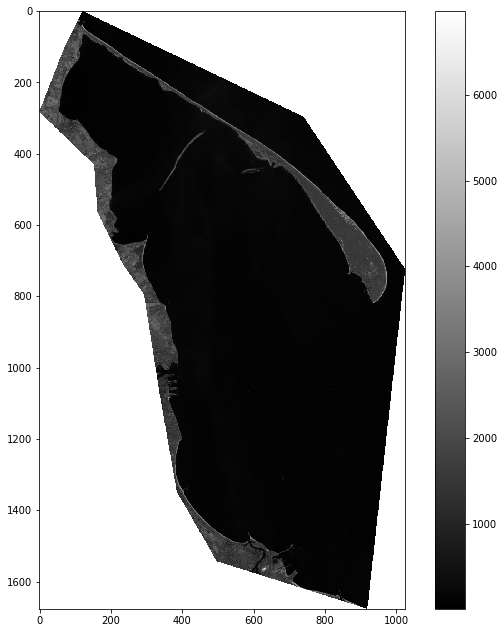
It is a single-band image of Gdansk Bay from satellite Landsat 8, taken in August 2018. Landsat 8 has 11 bands and we can mix them to create special products that enhance specific features on land or on the sea. Here is one of those “magic mixes” that enhances the visibility of Algal Blooms:
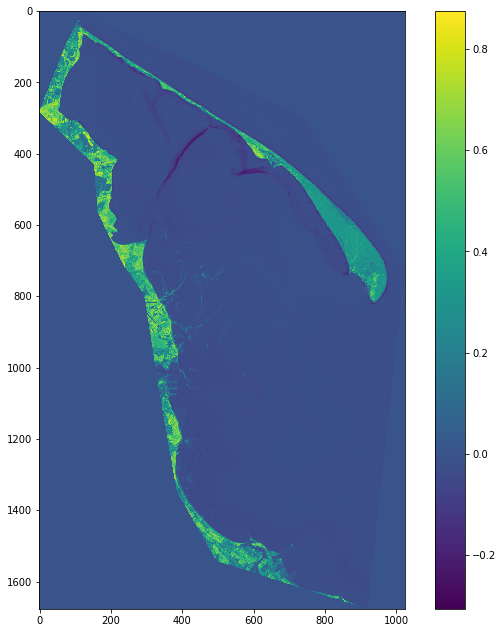
With appropriate band combination [10] we are able to transform the image and show long plumes of algae! (We will explore this property of satellite images in the future, within a dedicated data science article).
Summary
We haven’t explored all possible data sources, you can pick other than those mentioned in this article. Let’s look into a list of possible data sources that we might use:
- Local / regional / national media (articles, images, videos).
- Social Networks Data (Twitter – sentiment analysis; Instagram or TikTok – object detection).
- Google Trends.
- Satellites: Landsat 5, 7 (historical data), Landsat 8, 9, and Sentinel 2, 3 (current data and historical data) [C].
- Climate: Copernicus Climate Change Service (C3S), especially climate reanalysis datasets [D]. If you are in US/Canada/Mexico and C3S service doesn’t have data for your area, then you should rather take a look into NOAA datasets. Other countries have their own meteorological and climate data.
- Land Cover: Copernicus Land Monitoring Service [E].
- Genomics and Bio Datasets: Zenodo, for example [F].
I hope that you get interested in the algal blooms and how those affect our lives. In the future, we are going to explore ways to assess Algal Blooms
Bibliography
[1] 🐟 NOAA. What is a harmful algal bloom? Link: https://www.noaa.gov/what-is-harmful-algal-bloom.
[2] 🚑 NIEHS. Algal Blooms. Link: https://www.niehs.nih.gov/health/topics/agents/algal-blooms/index.cfm
[3] 🌍 Mazur-Marzec H, Bertos-Fortis M, Toruńska-Sitarz A, Fidor A, Legrand C. Chemical and Genetic Diversity of Nodularia spumigena from the Baltic Sea. Marine Drugs. 2016; 14(11):209. https://doi.org/10.3390/md14110209
[4] ☠️ Gad S.E. Saxitoxin, Editor(s): Philip Wexler, Encyclopedia of Toxicology (Third Edition), Academic Press, 2014, Pages 218-220, ISBN 9780123864550, https://doi.org/10.1016/B978-0-12-386454-3.00925-8.
[5] 🦀 Žegura B, Štraser A, Filipič M. Genotoxicity and potential carcinogenicity of cyanobacterial toxins – a review, Mutation Research/Reviews in Mutation Research, Volume 727, Issues 1–2, 2011, Pages 16-41, ISSN 1383-5742, https://doi.org/10.1016/j.mrrev.2011.01.002.
[6] 🪨 UC Berkeley. Cyanobacteria: Fossil Record. Link: https://ucmp.berkeley.edu/bacteria/cyanofr.html
[7] 🚜 Michalak A, Anderson E, Beletsky D, et all. Record-setting algal bloom in Lake Erie caused by agricultural and meteorological trends consistent with expected future conditions. PNAS, April 1, 2013. DOI: https://doi.org/10.1073/pnas.121600611
[8] 🌊 NASA Earth Observatory. Summer Blooms in the Baltic and Barents. Link: https://www.earthobservatory.nasa.gov/images/92462/summer-blooms-in-the-baltic-and-barents
[9] 🤢 Węsławski J. M. Bezradność czyli sinice nad morzem (Polish). Miesięcznik Dzikie Życie. 9/291, September 2018. Link: https://dzikiezycie.pl/archiwum/2018/wrzesien-2018/bezradnosc-czyli-sinice-nad-morzem/page:12
[10] ⚙️ Szymon Moliński. Transform Landsat 8 to estimate the algal bloom area. Github: https://github.com/SimonMolinsky/conferences-and-workshops/blob/main/2022/06/h4c/preparations/algal_bloom_detection-chlorophyll_alpha.ipynb
Datasets
[A] (PL) Trójmiasto.pl search results.
[B] (Eng) Google Trends results.
[C] (Eng) EarthExplorer (USGS).
[D] (Eng) Copernicus Climate Change Service.
[E] (Eng) Copernicus Land Monitoring Service.
[F] (Eng) Zenodo – S75 | CyanoMetDB | Comprehensive database of secondary metabolites from cyanobacteria.
Appendix
This article was created, in a slightly different version, for Hack4Change event workshops on how to tell stories with data.


